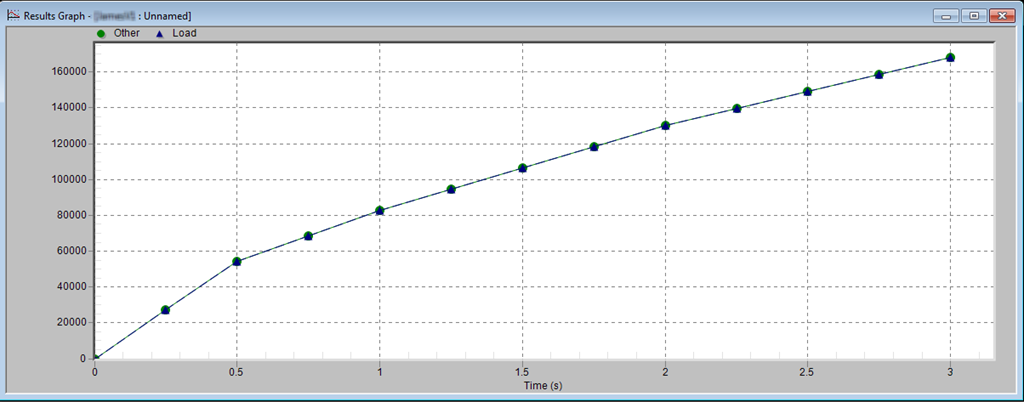
 Autodesk Simulation Multiphysics (formerly Algor) can format reports and graph any number of curve combinations. In this example, the displacement of two nodes are overlaid on one graph. This is a very simple example of some of the presentations that Simulation can do.
However sometimes we need to bring the data out of Simulation for use in a spreadsheet. For example, I’d like to see the differences between the values, and work with the results in another focus. Here’s how to get that data into Excel.
Export Presentation
Autodesk Simulation 2012 (formerly Algor) will allow users to export the contents of any presentation that is activated. Here, I use the term presentation because that is how the software describes the configurable dialogs that graph data. Head for the Application Menu.

Application Menu > Export > Export All (make sure you scroll to bottom)

Simply said, users can activate any presentation, pick Export All, and Simulation will dump the data being plotted to an ASCII file. Once activated the user will be presented with a dialog to select which data is to be exported, and how to format it. The formatting leaves a bit to be desired, but we can deal with it quickly in Excel. I’ve shown the basic settings that I prefer to use. Pick Export when done.
 After importing into Excel, it only takes a minute to move the columns as desired, and start using the data.

