
AutoCAD 2015 includes many new features and enhancements in the Geographic Location feature set. As part of our what’s new in AutoCAD 2015 series, we ask the question, what is Geolocation? From the AutoCAD help “Inserting geographic location information to a drawing file makes points within the drawing correspond to geographic locations on the surface of the Earth.”
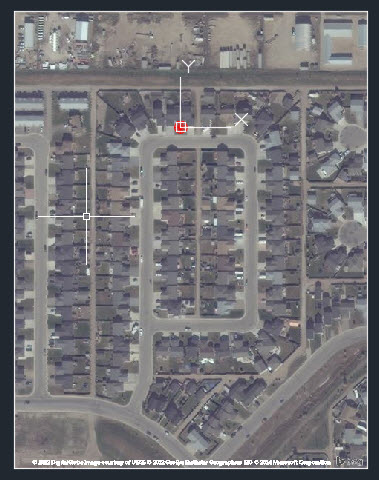
 Sample Map Attachment from the AutoCAD 2015 What’s New Document
What’s new in 2015?
- You can now set the geographic location from a map using Set Location on the ribbon. The process is now wizard driven and streamlined compared to 2014.
- You can capture and plot map data. Once an area is captured it is embedded into the drawing so even without internet access you can still view and plot the specific map area
- You can dynamically increase and decrease the map image resolution. This is useful as the highest resolution satellite image isn’t always the most recent
I will admit I didn’t use this a lot in 2014, but was interested in how much more “streamlined” and “intuitive” the new workflow was. So armed with my street address and a PDF of my house I set out to insert my house in the correct geographic location
Attaching Map Data
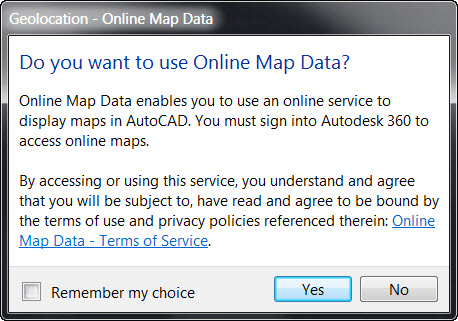
To start I set the geographic location using the Set Location > From Map option on the Insert Tab of the Ribbon. As I did not have any existing mapping data, I said yes to using the online data. After logging into my Autodesk 360 account and accepting the terms of use, the two page Specify Location dialog appeared.
With the Specify Location Wizard I enter the location of my house by street address, city, and country. It found the location so I picked this as the geo-marker location, which extracted the longitude, latitude, but not the elevation. A quick Google search and I entered in the elevation of the nearest city.
 Next was to pick the GIS Coordinate System. This didn’t mean much to me, but the tip in the dialog said the options were sorted based on the closest system to the origin I selected. So I picked the first one in the list… this is more intuitive! After setting the origin location to 0,0,0 and the north direction to 90, the Map was inserted into my drawing… quick and painless. The resolution of the map automatically adjusts as I zoom in the drawing, and the tighter I zoom in the more detail is added.
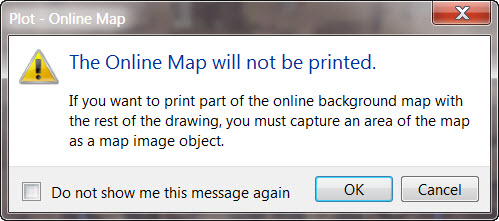
An important detail about online Map data, it does not plot!
 There are three options for how the mapping data can be displayed: Aerial, Road, and Hybrid.
 Map Images

Next I created a Map Image as I wanted something that I could plot and that was embedded in the drawing, I don’t always need to be connected to the Autodesk 360.
Map images behave just like raster images meaning the resolution and amount of detail is fixed and by zooming in only the magnification changes. Although the mapping data is cached it maintains a link and can be updated at any time. If you don’t like the rectangular boundary you can use grips to edit it onscreen like a raster image.
As I didn’t need the online mapping data at this point anymore I used the Map display option to turn it off
 As I zoomed in I realized that I didn’t have enough detail to my image and it was a bit dull. By selecting the Map Image, the Map Image Contextual Ribbon appears. I used the options to change the resolution and the brightness
 Looking good!
Attach PDF Underlay
Next I attached the PDF of my house plan and cropped it as close a possible. I then rotated it and scaled it as close as I could. [What I really should do at this point is use Raster Design to adjust the house plan to exact fit the mapping data, but that can be a future post.]
 In Review

The Geolocation features in AutoCAD 2015 are as advertised… intuitive and streamlined. With little experience with the toolset I was able to attach a map, crop it with the Map Image, and overlay my PDF. I was also very impressed by how quick the online service responded to my request and downloaded the required mapping information.
Watch Me Do it
[subscribe2]

